
Page 269 - Hitachi IR 2025
P. 269
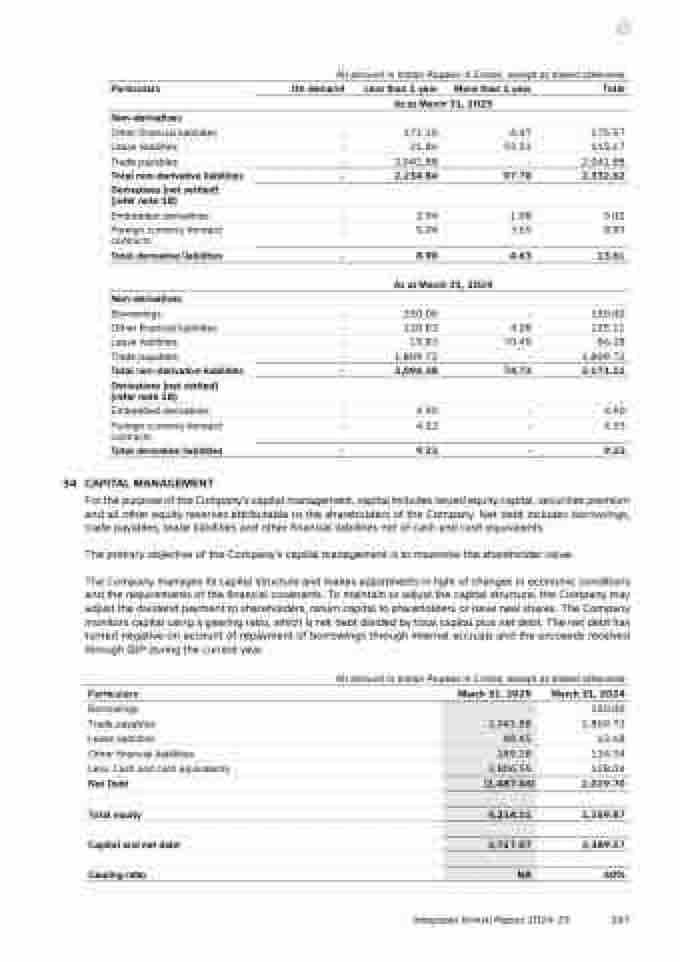
All amount in Indian Rupees in Crores, except as stated otherwise
Particulars On demand Less than 1 year More than 1 year Total
As at March 31, 2025
Non-derivatives
Other financial liabilities - 171.10 4.47 175.57
Lease liabilities - 21.86 93.31 115.17
Trade payables - 2,041.88 - 2,041.88
Total non-derivative liabilities - 2,234.84 97.78 2,332.62
Derivatives (net settled)
(refer note 18)
Embedded derivatives - 3.94 1.08 5.02
Foreign currency forward
contracts
- 5.04 3.55 8.59
Total derivative liabilities - 8.98 4.63 13.61
As at March 31, 2024
Non-derivatives
Borrowings - 150.00 - 150.00
Other financial liabilities - 120.83 4.28 125.11
Lease liabilities - 15.83 70.45 86.28
Trade payables - 1,809.72 - 1,809.72
Total non-derivative liabilities - 2,096.38 74.73 2,171.11
Derivatives (net settled)
(refer note 18)
Embedded derivatives - 4.90 - 4.90
Foreign currency forward
contracts
- 4.33 - 4.33
Total derivative liabilities - 9.23 - 9.23
34 CAPITAL MANAGEMENT
For the purpose of the Company’s capital management, capital includes issued equity capital, securities premium
and all other equity reserves attributable to the shareholders of the Company. Net debt includes borrowings,
trade payables, lease liabilities and other financial liabilities net of cash and cash equivalents.
The primary objective of the Company’s capital management is to maximise the shareholder value.
The Company manages its capital structure and makes adjustments in light of changes in economic conditions
and the requirements of the financial covenants. To maintain or adjust the capital structure, the Company may
adjust the dividend payment to shareholders, return capital to shareholders or issue new shares. The Company
monitors capital using a gearing ratio, which is net debt divided by total capital plus net debt. The net debt has
turned negative on account of repayment of borrowings through internal accruals and the proceeds received
through QIP during the current year.
All amount in Indian Rupees in Crores, except as stated otherwise
Particulars March 31, 2025 March 31, 2024
Borrowings - 150.00
Trade payables 2,041.88 1,809.72
Lease liabilities 88.45 63.68
Other financial liabilities 189.18 134.34
Less: Cash and cash equivalents 3,806.55 128.04
Net Debt (1,487.04) 2,029.70
Total equity 4,214.11 1,359.87
Capital and net debt 2,727.07 3,389.57
Gearing ratio NA 60%
Integrated Annual Report 2024-25
267
