
Page 166 - Hitachi IR 2025
P. 166
MANAGEMENT DISCUSSION & ANALYSIS
Financial performance
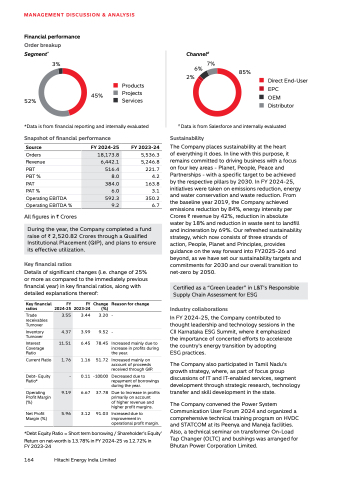
Order breakup
Segment* Channel#
3%
7%
6%
85%
2% Direct End-User
EPC
OEM
Distributor
Products
Projects
Services
45%
52%
*Data is from financial reporting and internally evaluated Snapshot of financial performance
Source FY 2024-25 FY 2023-24
Orders 18,173.8 5,536.3
Revenue 6,442.1 5,246.8
PBT 516.4 221.7
PBT % 8.0 4.2
PAT 384.0 163.8
PAT % 6.0 3.1
Operating EBITDA 592.3 350.2
Operating EBITDA % 9.2 6.7
All figures in ` Crores
During the year, the Company completed a fund
raise of ` 2,520.82 Crores through a Qualified
Institutional Placement (QIP), and plans to ensure
its effective utilization.
# Data is from Salesforce and internally evaluated
Sustainability
The Company places sustainability at the heart
of everything it does. In line with this purpose, it
remains committed to driving business with a focus
on four key areas - Planet, People, Peace and
Partnerships - with a specific target to be achieved
by the respective pillars by 2030. In FY 2024-25,
initiatives were taken on emissions reduction, energy
and water conservation and waste reduction. From
the baseline year 2019, the Company achieved
emissions reduction by 84%, energy intensity per
Crores ` revenue by 42%, reduction in absolute
water by 18% and reduction in waste sent to landfill
and incineration by 69%. Our refreshed sustainability
strategy, which now consists of three strands of
action, People, Planet and Principles, provides
guidance on the way forward into FY2025‑26 and
beyond, as we have set our sustainability targets and
commitments for 2030 and our overall transition to
net-zero by 2050.
Key financial
ratios
Trade
receivables
Turnover
3.55 3.44 3.20-
Inventory
Turnover
4.37 3.99 9.52-
Interest
Coverage
Ratio
Key financial ratios
Details of significant changes (i.e. change of 25%
or more as compared to the immediately previous
financial year) in key financial ratios, along with
detailed explanations thereof:
FY
2024-25
FY
2023-24
Change
(%)
Reason for change
11.51 6.45 78.45 Increased mainly due to
increase in profits during
the year.
Current Ratio 1.76 1.16 51.72 Increased mainly on
account of proceeds
received through QIP.
- 0.11 - 100.00 Decreased due to
repayment of borrowings
during the year.
9.19 6.67 37.78 Due to Increase in profits
primarily on account
of higher revenue and
higher profit margins.
5.96 3.12 91.03 Increased due to
improvement in
operational profit margin.
*Debt Equity Ratio = Short term borrowing / Shareholder’s Equity’
Return on net-worth is 13.78% in FY 2024-25 vs 12.72% in
FY 2023-24
164 Hitachi Energy India Limited
Certified as a “Green Leader” in L&T’s Responsible
Supply Chain Assessment for ESG
Debt- Equity
Ratio*
Operating
Profit Margin
(%)
Net Profit
Margin (%)
Industry collaborations
In FY 2024-25, the Company contributed to
thought leadership and technology sessions in the
CII Karnataka ESG Summit, where it emphasized
the importance of concerted efforts to accelerate
the country's energy transition by adopting
ESG practices.
The Company also participated in Tamil Nadu's
growth strategy, where, as part of focus group
discussions of IT and IT-enabled services, segment
development through strategic research, technology
transfer and skill development in the state.
The Company convened the Power System
Communication User Forum 2024 and organized a
comprehensive technical training program on HVDC
and STATCOM at its Peenya and Maneja facilities.
Also, a technical seminar on transformer On-Load
Tap Changer (OLTC) and bushings was arranged for
Bhutan Power Corporation Limited.