
Page 282 - Hitachi IR 2025
P. 282
NOTES TO THE FINANCIAL STATEMENTS
g) Nature of CSR activities:
i. Promote gender equality and empowering of women in engineering workforce
ii. Endorse Education, employability & healthcare
iii. Social impact projects
iv. Support national disaster management and other government initiatives
v. Aid in sustainable development goals
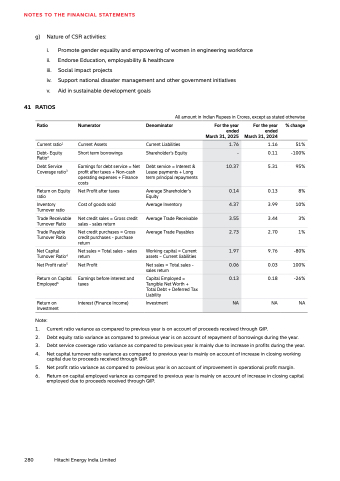
41 RATIOS
All amount in Indian Rupees in Crores, except as stated otherwise
Current ratio1 Current Assets Current Liabilities 1.76 1.16 51%
Debt Service
Coverage ratio3
Ratio Numerator Denominator For the year
ended
March 31, 2025
For the year
ended
March 31, 2024
Debt service = Interest &
Lease payments + Long
term principal repayments
% change
Debt- Equity
Ratio2
Short term borrowings Shareholder’s Equity - 0.11 -100%
Earnings for debt service = Net
profit after taxes + Non-cash
operating expenses + Finance
costs
10.37 5.31 95%
Return on Equity
ratio
Net Profit after taxes Average Shareholder’s
Equity
0.14 0.13 8%
Inventory
Turnover ratio
Cost of goods sold Average Inventory 4.37 3.99 10%
Trade Receivable
Turnover Ratio
Net credit sales = Gross credit
sales - sales return
Average Trade Receivable 3.55 3.44 3%
Trade Payable
Turnover Ratio
Net credit purchases = Gross
credit purchases - purchase
return
Average Trade Payables 2.73 2.70 1%
Net Capital
Turnover Ratio4
Net sales = Total sales - sales
return
Working capital = Current
assets – Current liabilities
1.97 9.76 -80%
Net Profit ratio5 Net Profit Net sales = Total sales -
sales return
0.06 0.03 100%
Return on Capital
Employed6
Earnings before interest and
taxes
Capital Employed =
Tangible Net Worth +
Total Debt + Deferred Tax
Liability
0.13 0.18 -26%
Return on
Investment
Interest (Finance Income) Investment NA NA NA
Note:
1. 2. 3. 4. 5. 6. Current ratio variance as compared to previous year is on account of proceeds received through QIP.
Debt equity ratio variance as compared to previous year is on account of repayment of borrowings during the year.
Debt service coverage ratio variance as compared to previous year is mainly due to increase in profits during the year.
Net capital turnover ratio variance as compared to previous year is mainly on account of increase in closing working
capital due to proceeds received through QIP.
Net profit ratio variance as compared to previous year is on account of improvement in operational profit margin.
Return on capital employed variance as compared to previous year is mainly on account of increase in closing capital
employed due to proceeds received through QIP.
280 Hitachi Energy India Limited
